The last few years since the COVID-19 pandemic I became interested in gardening and growing food in my garden, however I had no reference or experience to know when to start planting seeds, so I lost some of my first plants the first year to the extreme heat and draughts of spring. This taught me that spring is a cruel season for plants in Leon and made me wonder when I should begin planting my seeds and make the best use of the rainy season.
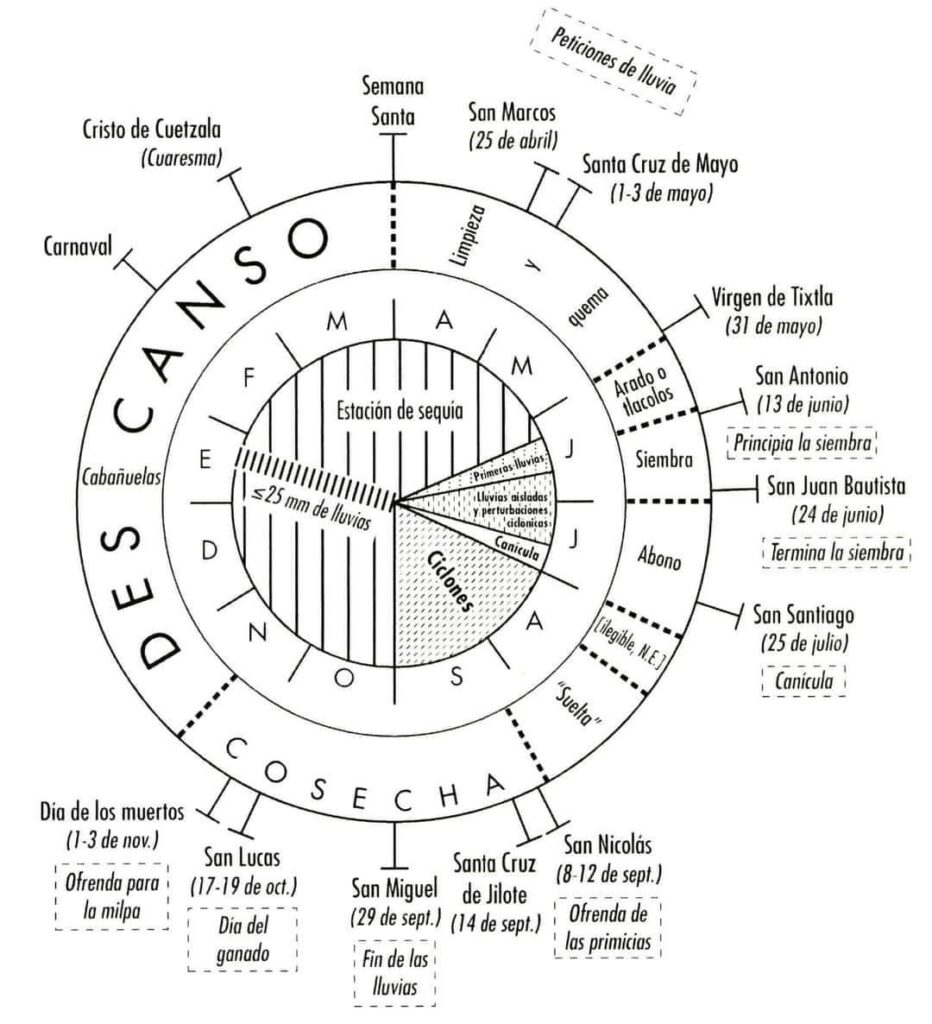
It was later that I found this graphic that illustrates the traditional agricultural calendar for a region in Guerrero in an article by Hémond, Aline and Marina Goloubinoff.1 and immediately wished for a similar one for Leon. This is how I did it: I downloaded the climatologic data for Leon from the CONAGUA website (https://smn.conagua.gob.mx/tools/RESOURCES/Diarios/11040.txt) and then imported the data to MySQL.
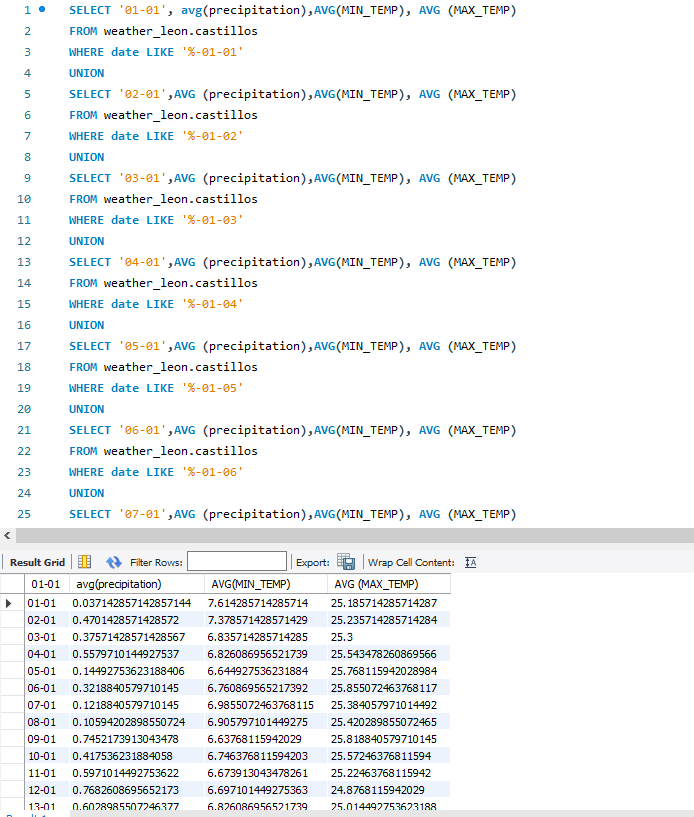
This query selects the rows for every 1st of January of all the years I have data for and averages the precipitation, min temperature and max temperature. The “WHERE date LIKE ‘%-01-01″ statement selects the rows where the date is any year -01-01SELECT '01-01', avg(precipitation),AVG(MIN_TEMP), AVG (MAX_TEMP)
FROM weather_leon.castillos
WHERE date LIKE '%-01-01'
Next I made unions for the rest of the days of the year and exported the table to a csv file.
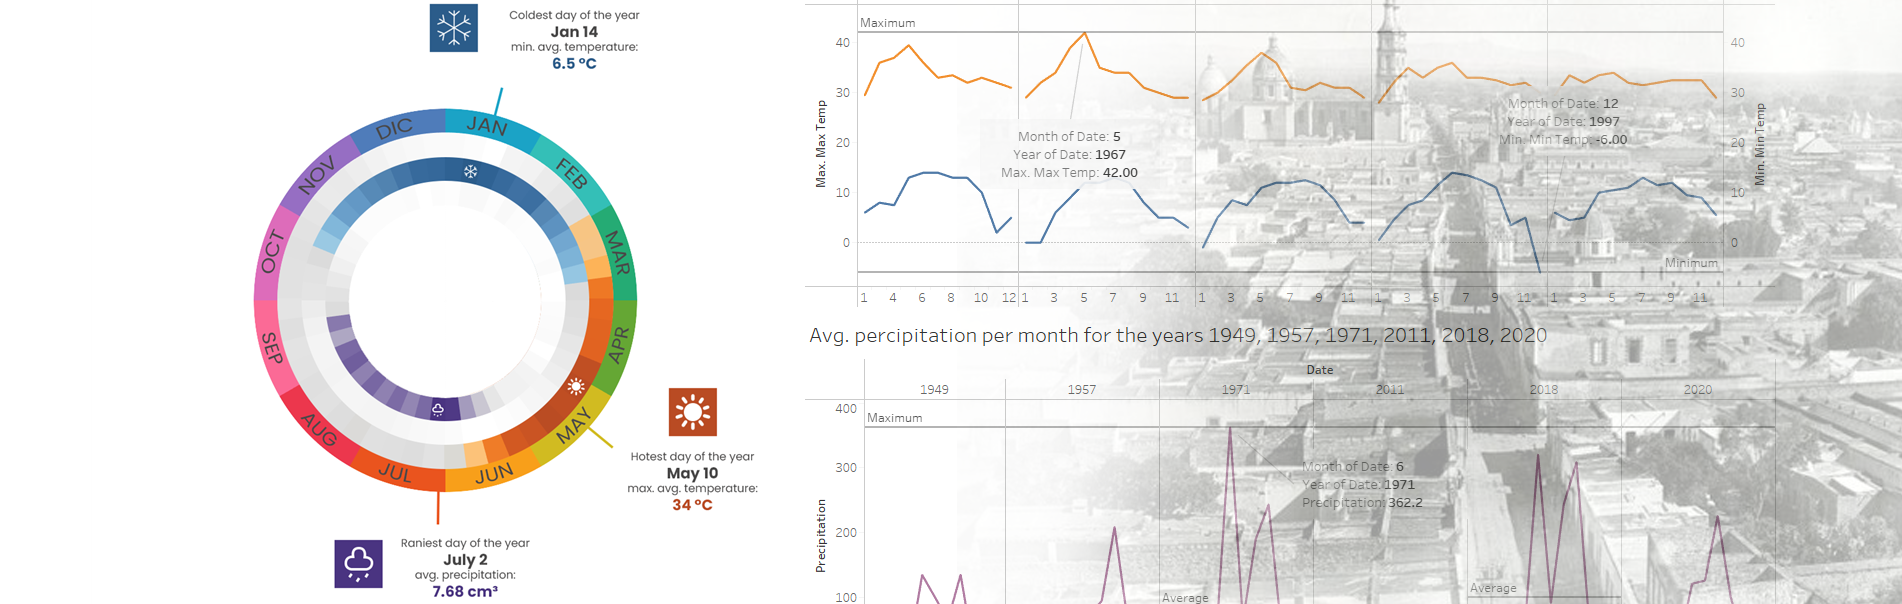
The visualization was created with a radial heatmap in Tableau and some text and graphics added in an image editing software. The coldest days of the year tend to occur around the second week of January, while the hottest days of the year happen around the first or second week of May. As for the rains, the heaviest rains tend to happen around the first week of July. This means I should plant my annual plants around mid June in order to make the most of the rainy season.
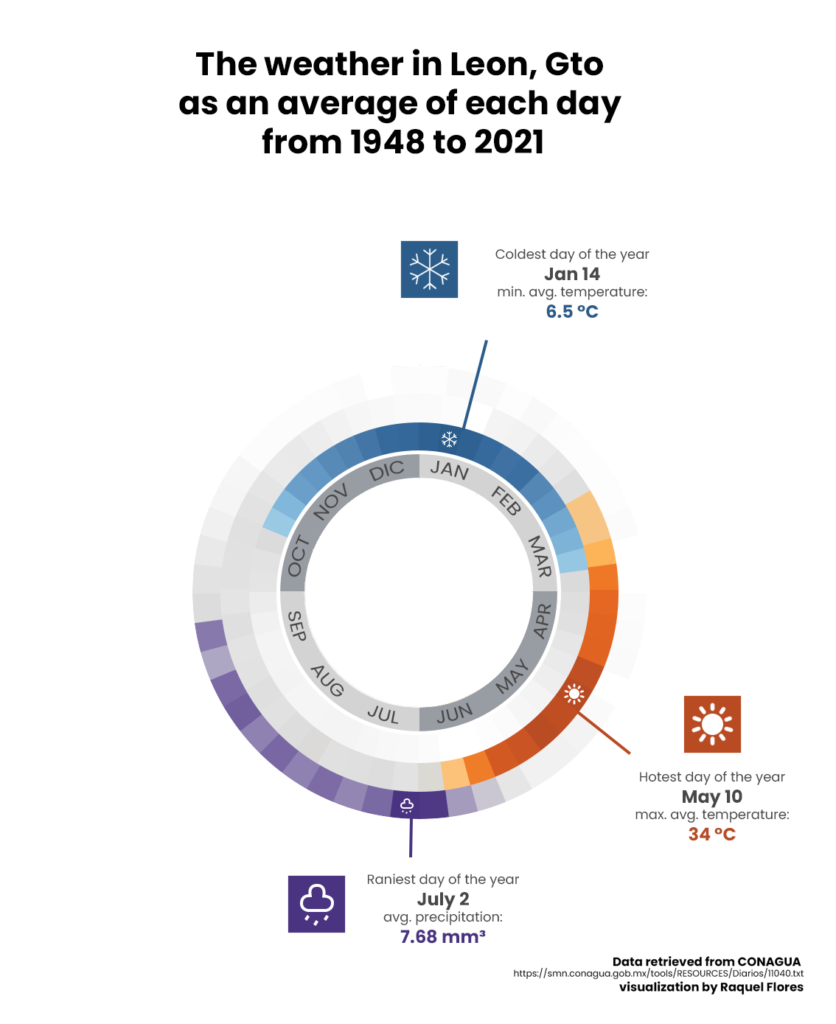
But let’s explore more of the data.
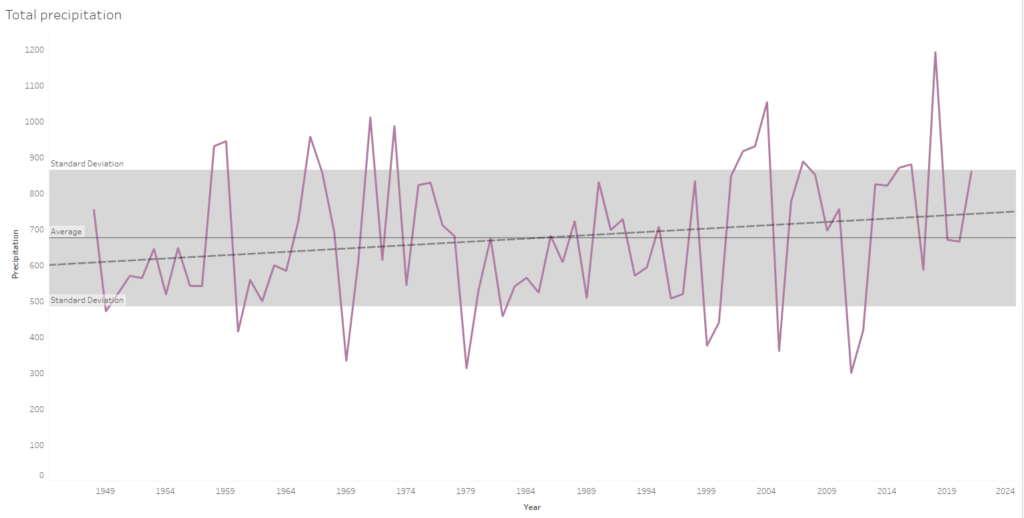
The average yearly rainfall for Leon is 675 mm. The year with most rainfall was 2018 with 1,193mm and the year with least rainfall was 2011 with 300.6mm
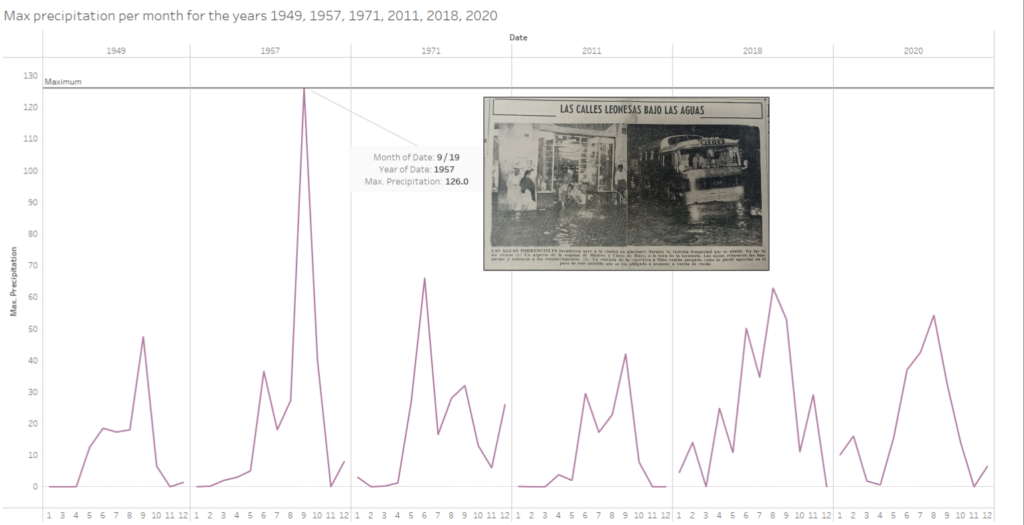
The day with the most rainfall registered was September 19, 1957 when it rained 126mm, around double what tends to rain on the biggest storms of other years. Below, a clip from the newspaper El Sol de Leon, September 20th, 1957. At least five people died and many stores and homes suffered damages to property.

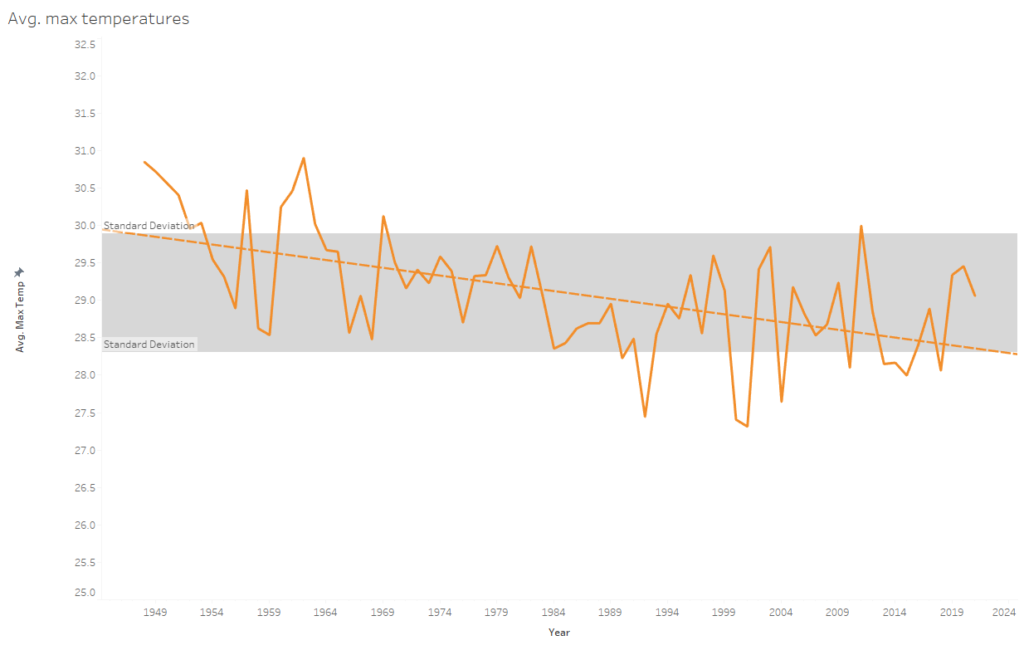
If we average the max temperatures of the year we find that 1962 was the hottest year with an average max temperature of 30.9 C.
2001 was the year with the lowest max temperatures on average, with an average max temperature of 27.3 C
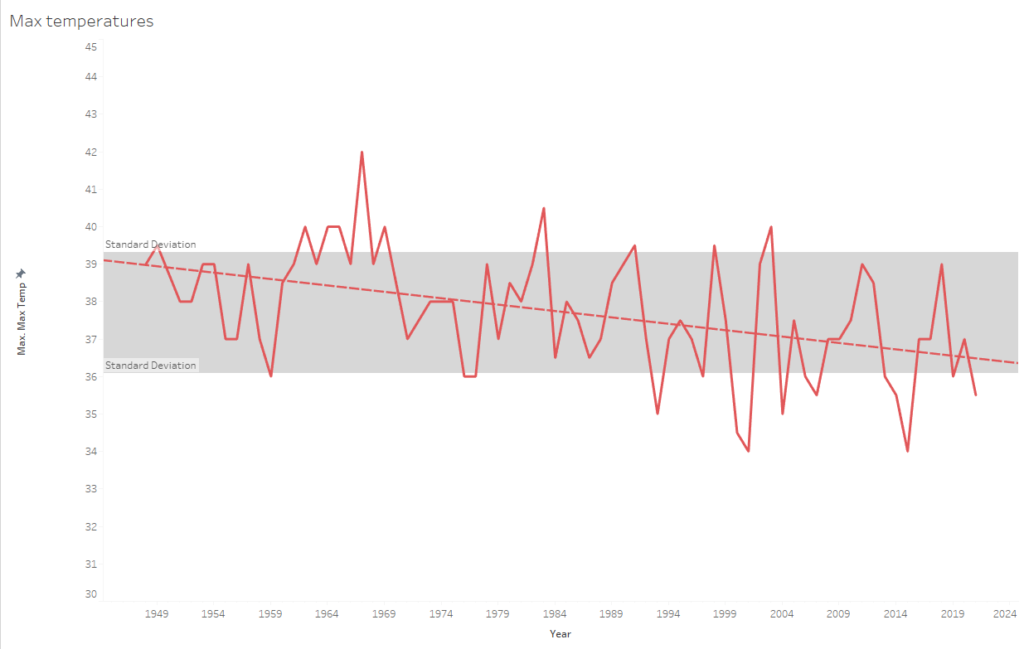
The year with the hottest temperature registered was 1967 with a temperature of 42C. 2001 and 2015 both had the lowest max temperature (34 C).
The year when the coldest temperature was recorded was -6 C on December 14, 1997.
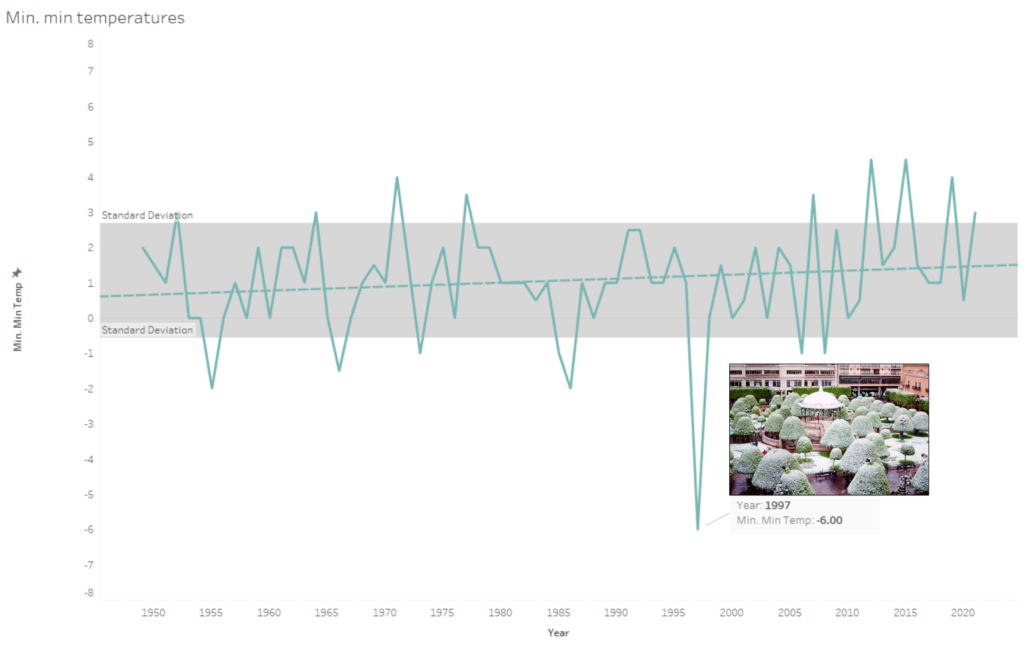
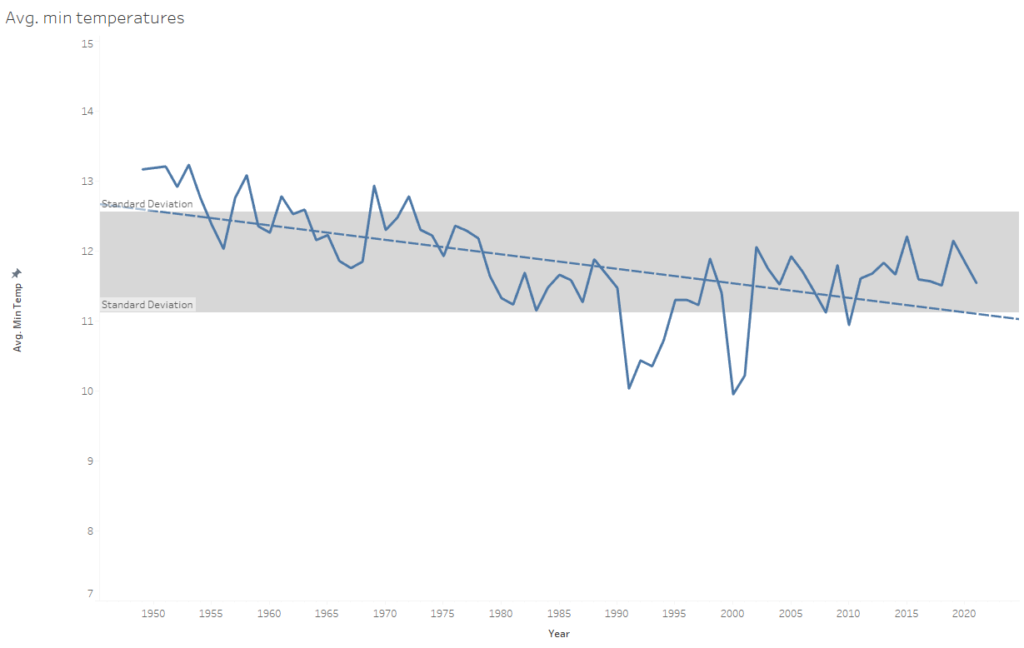
On average, 1953 was the year with the highest low temperatures with 13.2 C as an average min temperature and the year 2000 had the lowest low temperatures with an average min temperature of 9.9C.
This project is a work in progress and I will continue adding more to it as I gather more data and find more insights.
- Hémond, Aline, et Marina Goloubinoff. « El “Via Crucis del agua”. Clima, calendario agrícola y religioso entre los nahuas de Guerrero ». Aires y lluvias. Antropología del clima en México, édité par Annamária Lammel et al., Centro de estudios mexicanos y centroamericanos, 2008, https://doi.org/10.4000/books.cemca.1264. ↩︎