Project Background
Agave is the plant family from which both Tequila and Mezcal are produced. While any type of Agave will be used for producing Mezcal, Tequila is made from Agave Tequilana Weber only, which is grown exclusively in the states of Jalisco, Guanajuato, Michoacán, Nayarit and Tamaulipas. This Analysis will center in Jalisco from 1986 to 2023.
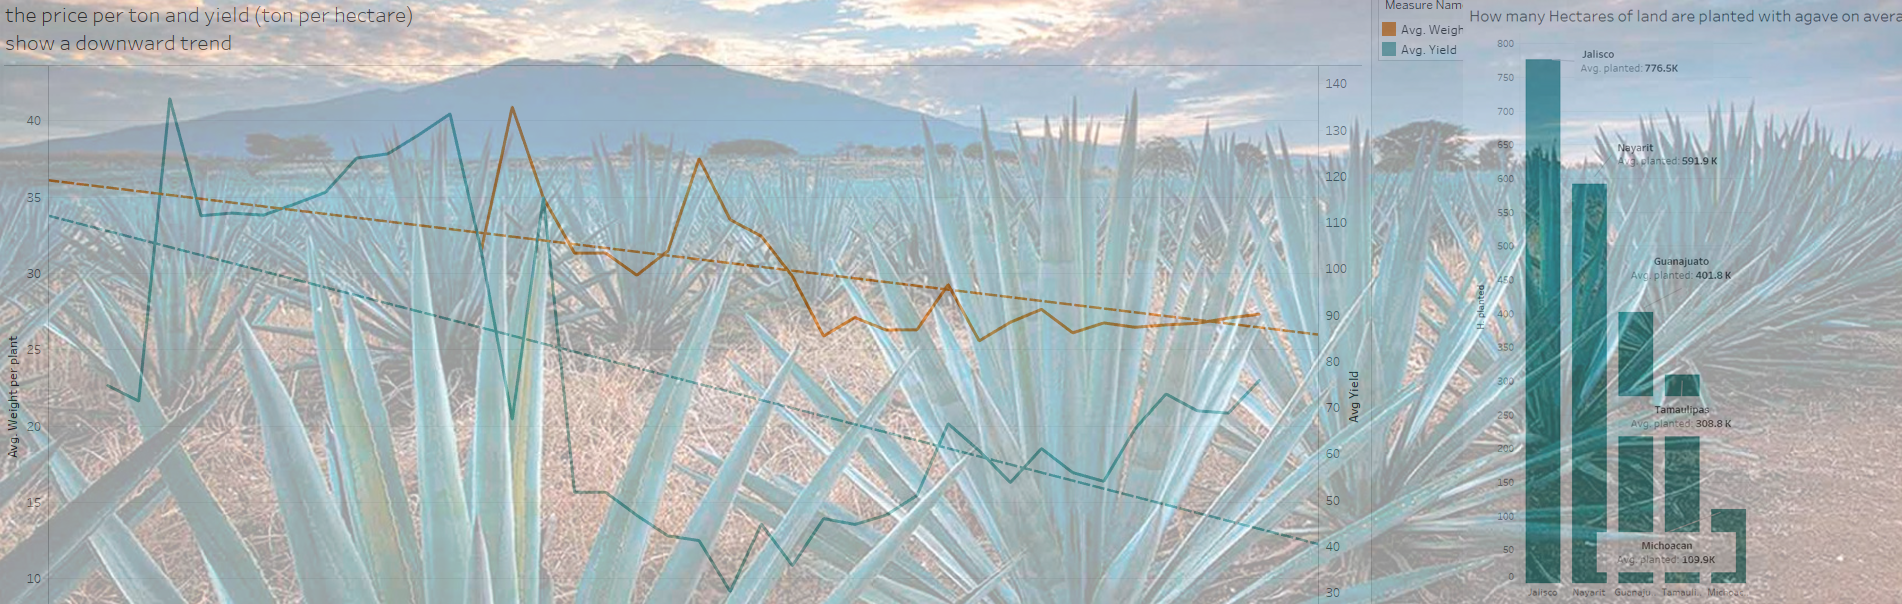
Agave was traditionally harvested 8 to 10 years after being planted, just as it started its flowering process. This lapse of time and the loss of plants has made it hard to calculate how much to plant each year to meet demand and as a result, the growing times have decreased along with the average yield (ton per hectare) and the average weight per agave plant.
Insights and recommendations are provided on the following key areas:
- Price and harvest: Evaluation of historical harvest patterns in Jalisco, Guanajuato and the relationship between the number of hectares harvested and the price per ton of Agave in Jalisco.
- Loss of hectares planted: An analysis of the loss of hectares planted with agave and the regions most affected.
- The changes in yield: An assessment of the changes in yield (tons per hectare) over time and average weight per plant.
The SQL queries utilized to clean, organize, and prepare data for the dashboard can be found here.
An interactive Tableau dashboard used to report and explore trends can be found here.
Data Structure & Initial Checks
The data used was taken from the open data at the Agro-alimentary and Fishing Information Service (SIAP) website. The data was distributed along 44 tables, one for each year from 1980 to 2023, containing data for all farming produce, not only Agave. The tables follow 2 different formats that were later consolidated into a single file in SQL, keeping only the data for agave cultivation that was relevant for the analysis.
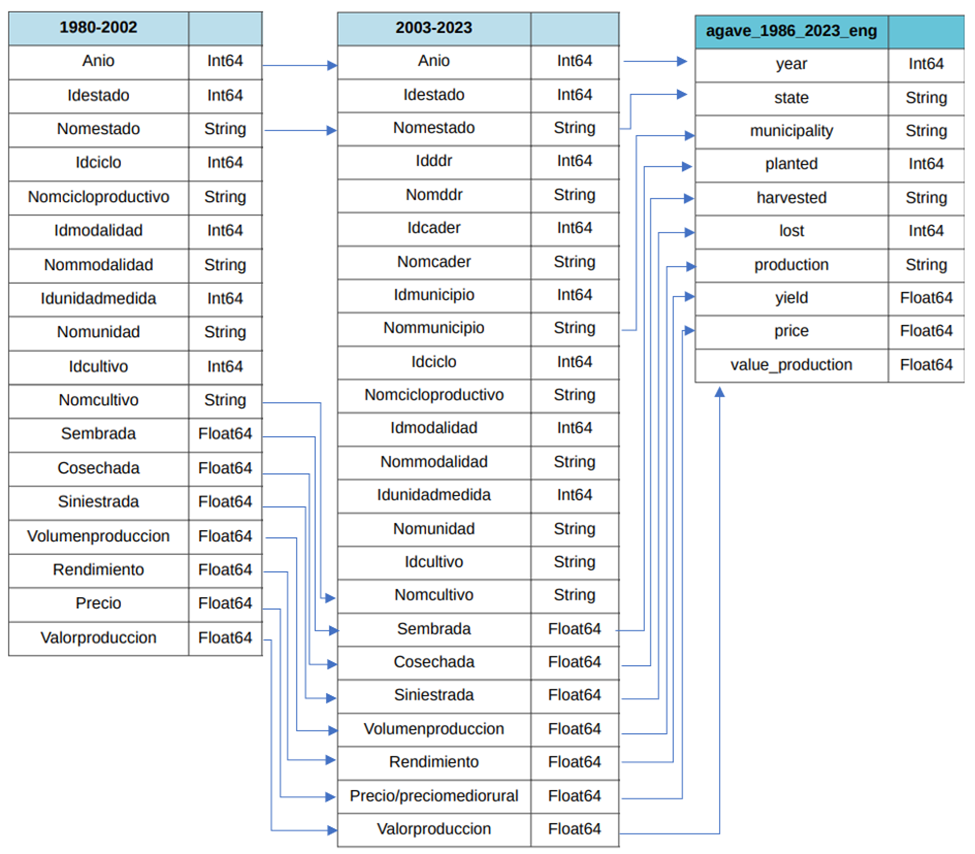
Units for Planted, Harvested and Lost are in Hectares (Ha.)
Units for production are in Tons
Units for Yield are in Tons/Ha
Price and value_production are in Mexican Pesos
Executive Summary
Overview of Findings
Following the growth of popularity of Tequila, prices per ton of agave keep going up and years with harvest deficit keep happening. Farmers have difficulties meeting the demand for Agave despite an increase in the hectares planted with it. This difficulty can be attributed to an average lower yield and a lower average weight per plant of Agave, but mainly to the huge losses of hectares planted with agave. The following sections will explore the farming practices of Agave Tequilana Weber from 1986 to 2023 and highlight avenues for improvement in Agave production.
Below is the Dashboard from Tableau and more data visualizations are included throughout the report. The interactive dashboard can be downloaded here.
Read a digital version of this report here: https://github.com/Isildil/agave/blob/main/README.md
A. Harvest and prices of Agave Tequilana
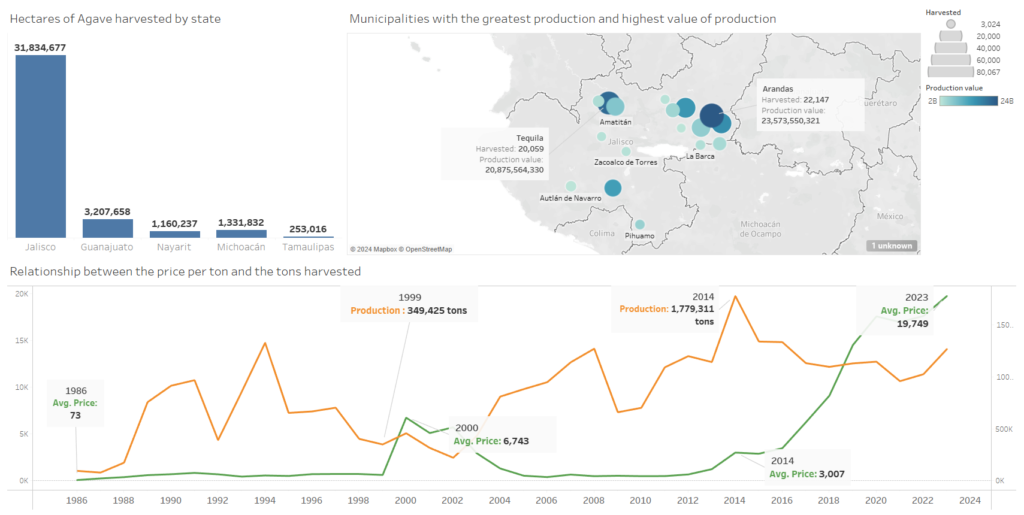
- Jalisco is the state with the largest production of Agave. Jalisco produces 4.3 more agave than the other states together, Guanajuato comes in second place, but Jalisco produces 7.2 times the Agave production of Guanajuato.
- The municipalities where most Agave is produced in Jalisco are located at the North-East and North of the state. Arandas has harvested 22,147 Hectares, Tequila 20,059, Jesus Maria 15,360, Tepatitlan 15,057. The production value for these municipalities is 23.5 billion (23.5 thousand millions) for Arandas, 20.8B for Tequila, 15.5B for Jesus Maria and 14.4B for Tepatitlan.
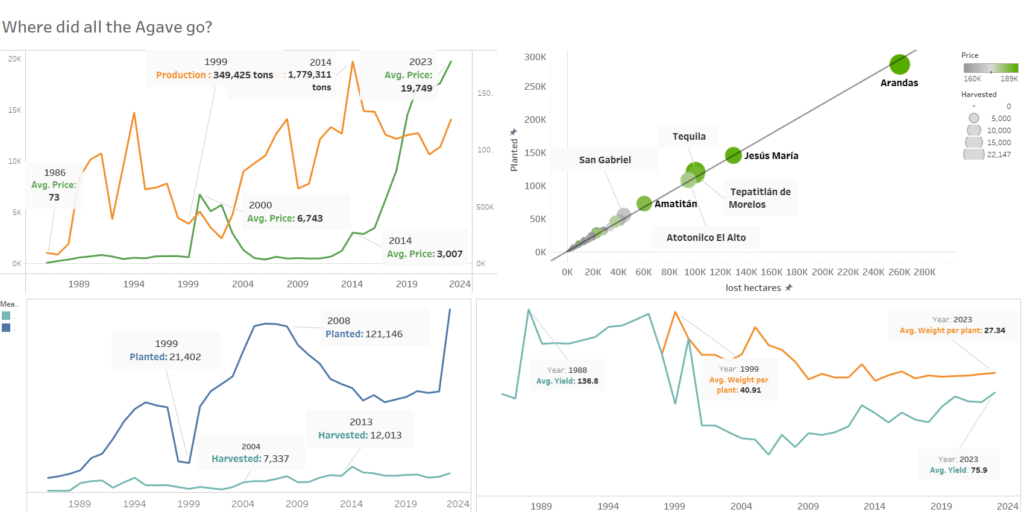
- The production of Agave has had an 18-fold increase since 1988. In Jalisco, 394,920 tons of Agave were produced in 1986 and in 2023, 1,268, 502 hectares. The production of Agave has an erratic growth curve, with big dips and spikes due to the slow rate of plant growth, the difficulty to estimate how many hectares will be needed to satisfy demand and the loss of plants to pests and diseases. Years where a surplus of Agave is produced are followed by years with underproduction.
- Periods where the shortage of Agave lasts for 5 or more years are followed by spikes in prices. In 1994 the harvest reached the highest point up to that year but then the production dropped the next year and until 2003; prices went up from $616 in 1999 to $6,748 in 2000. In 2008 the production of Agave got to a record of 1,272,074 but then dropped and didn’t recover until 2012; prices increased near threefold from 2013 ($1,239) to 2014($3,007).
- The avg. price per ton is 6.5 times higher than in 2014 The average price per ton (rural price) in 2023 was $19,749 MXN. The price of Agave has been in an upward trend since 2010
B. Loss of hectares planted
- 2,306,704 Hectares of Agave have been lost since 1986. They have gone unreported and the reasons for the lost crops are unknown, but some possibilities are disease, pests and theft.
- From 1999 to 2008 the number planted hectares increased 5.6 times. However, 5 years later, from 2004 to 2013, harvest only increased 1.6 times.
- The number of hectares planted is strongly correlated with the lost hectares. The municipalities with the most losses are the ones with the most hectares planted and also where the price per ton is the highest.
- Arandas is the Municipality with the most economic losses averaging at $1,425,840 pesos every year.
- The percentage of lost hectares is in a downward trend for some of the highest-producing Municipalities since 2003. Arandas is down 11.4%
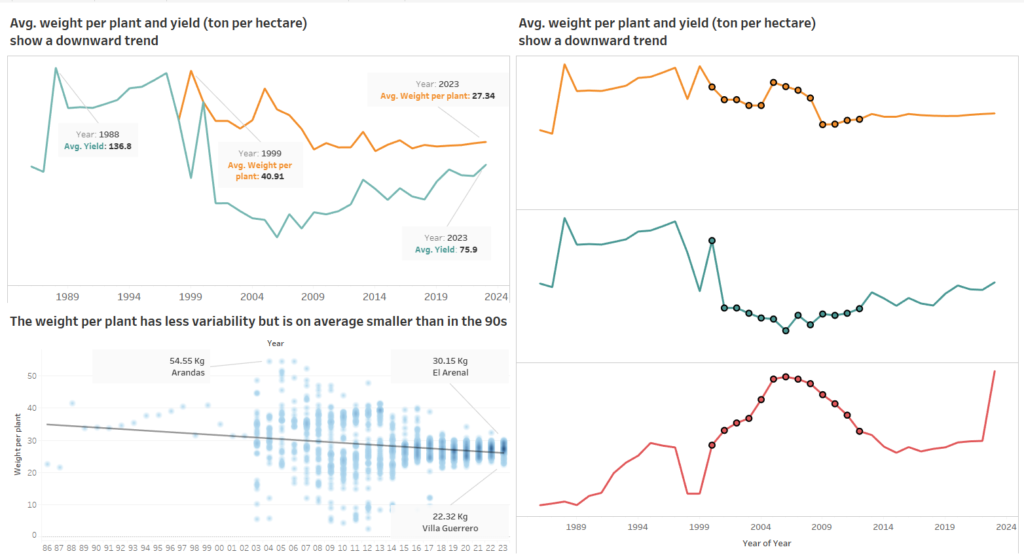
C. The changes in yield:
- Yield shows a downward trend. The average yield (tons of agave per hectare harvested) is down 49% since the highest point in 1988
The average weight per plant has decreased by 15 Kg since 1999, stabilizing at a little over 25Kg per plant since 2014. - The avg. weight per plant and the avg. yield are directly related except for the years where the loss of hectares was the greatest. Between 2000 and 2012 there was a significant increase in the lost hectares planted with agave and those years both the avg. yield and the avg. weight per plant become erratic.
- The lost hectares follow 3 different patterns: from 2000 to 2005(shaded area A): heavier plants were lost and this brought the avg. down. From 2006 to 2009(shaded area B) smaller plants were lost, hence the increase in avg. weight per plant. From 2010 to 2012 (shaded area C) again, heavier plants were lost and the avg. weight per plant went down. This again suggests theft as the main reason for the loss of these plants, heavier plants being the first targets, then smaller plants
Recommendations:
Based on the insights and findings above, the following recommendations are provided:
- The death of hectares planted with agave is most prevalent in areas densely and extensively planted with agave. It is recommended that perimeters of native plants surround fields every few hectares and adjacent to roads. With special attention to fields inside the perimeter below. This will serve two purposes:
- Introducing biodiversity that will act as buffer zones to avoid the spread of pests and diseases.
- Extending and conserving the natural habitat of the natural enemies of pests like Picudo del Agave such as beetles that eat larvae (genus Hololepta) which live in areas with dead vegetation.
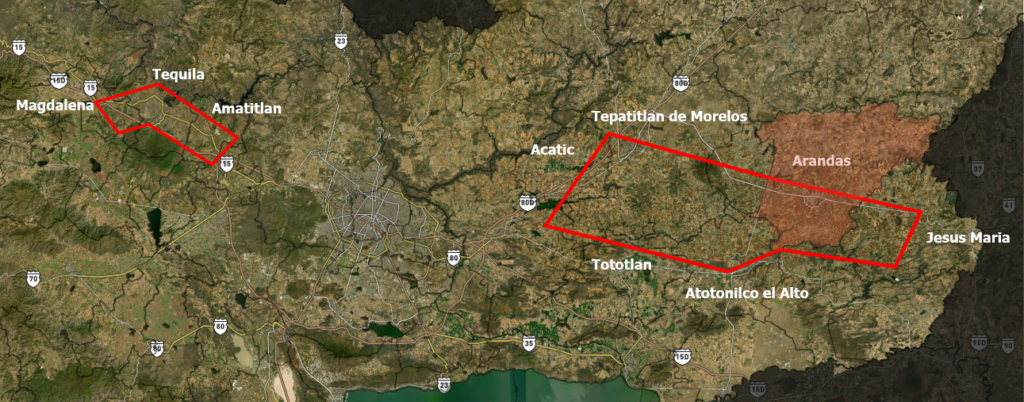
- Most of the Agave for Tequila is grown in 6 Municipalities. This is a risky practice both from the perspective of theft prevention and from the perspective of preservation of the species. Promote the cultivation of tequila outside of Valles de Jalisco and the border between Altos and Cienega de Jalisco.
- The yield has gone down since the 1980s and it is correlated with the early harvesting of agave. Investing in a study to find the growth rate of Agave Tequilana Weber could bring insight into the ideal point in the growth curve where to harvest the plant for the best yield.
- Once the ideal harvesting timeline is decided, make yearly projections of tequila demand and set state-wide goals for hectares to be planted so as to keep a steady supply of Agave and avoid both Under and Overproduction.
Assumptions and Caveats:
Throughout the analysis, multiple assumptions were made to manage challenges with the data. These assumptions and caveats are noted below:
- The 0 lost hectares reported is an error or mistake in recollecting the data, the data used for the lost hectares was obtained by subtracting the Harvested hectares to the Planted Hectares.
- All data for Agave is related to the species of Agave Tequilana Weber
- Planting density is assumed to be 3300 plants per hectare
- It is assumed harvest happens after 5 years of planting
Leave a Reply