
Project Background
A Portuguese bank conducts a telemarketing campaign with the purpose to have clients invest in a bank term deposit. Often, more than one contact to the same client was required.
This analysis will describe the performance of the campaign and recommend changes that could make the next campaign more successful by focusing the efforts on different sectors of the bank’s population each month of the year.
Insights and recommendations are provided on the following key areas:
- Demographics: description of the bank’s demographics
- KPIs and the descriptive analysis of the campaigns: Analysis on the data obtained from the previous marketing campaigns: number of clients reached, number of calls, conversion rate, subscription ratio, average handle time, average call duration
- Results of the calls to clients with loans: An assessment of the months with best subscription rates for clients with loans (personal or housing loans).
- Results of the calls to clients without loans: An evaluation of subscription rates by occupation each month.
The SQL queries utilized to clean, organize, and prepare data for the dashboard can be found here
A Power Bi dashboard used to report and explore trends can be found here
Data Structure & Initial Checks
The data used was taken from the UC Irvine Machine Learning Repository and it consists of one table with 45,211 rows and 17 columns. Is is real data collected from a Portuguese retail bank, from May 2008 to June 2013, with a total of 52944 phone contacts.
Variables:
1. Age (numeric)
2. Job (categorical: admin, unknown, unemployed, management, housemaid, entrepreneur, blue-collar, self-employed, retired, technician, services)
3. Marital (categorical: married, divorced, single. Divorced means divorced or widowed)
4. Education (categorical: unknown, primary, secondary, tertiary)
5. Default: has credit in default? (binary: yes, no)
6. Balance: average yearly balance, in euros (numeric)
7. Housing: has housing loan? (binary: “yes”, “no”)
8. Loan: has personal loan? (binary: “yes”, “no”)
9. contact: last contact communication type (categorical: unknown, telephone, cellular)
10. day: last contact day of the month (numeric)
11. month: last contact month of year categorical: jan, feb, mar, …, nov, dec)
12. duration: last contact duration, in seconds (numeric)
13. campaign: number of contacts performed during this campaign and for this client (numeric, includes last contact)
14. pdays: number of days that passed by after the client was last contacted from a previous campaign (numeric, -1 means client was not previously contacted)
15. previous: number of contacts performed before this campaign and for this client (numeric)
16. poutcome: outcome of the previous marketing campaign (categorical: “unknown”, “other”, “failure”, “success”)
Output variable:
y – has the client subscribed a term deposit? (binary: “yes”, “no”)
There are no missing attribute values and no duplicate rows.
Note: A Term deposit is a deposit that a bank or a financial institution offers with a fixed rate (often better than just opening deposit account) in which your money will be returned back at a specific maturity time.
Executive Summary
Overview of Findings
The campaigns have been successful overall, with a conversion rate of 4.23, above the average 3.1 conversion rate for telemarketing campaigns in the finance industry.
The telemarketing campaign seems to already have gone through some iterations in the number of calls made to each profession each month, since the number of clients reached each month are not random.
One of the difficulties in this campaign was that the job most represented in the bank’s clients is blue-collar jobs, which also has one of the lowest conversion rates. This could be attributed to the fact that:
72% of blue-collar clients have a housing loan. This represents 28.5% of the clients with housing loan. Blue-collar clients with a housing loan could very well not be able to save more money. For these reasons, the following analysis will divide the client population into those with housing loan (55.8%) and those without (44.42%). Clients without housing loans have double the conversion rate that those who have a housing loan. Furthermore, the clients with housing loans subscribe to term deposits during a more limited timeframe.
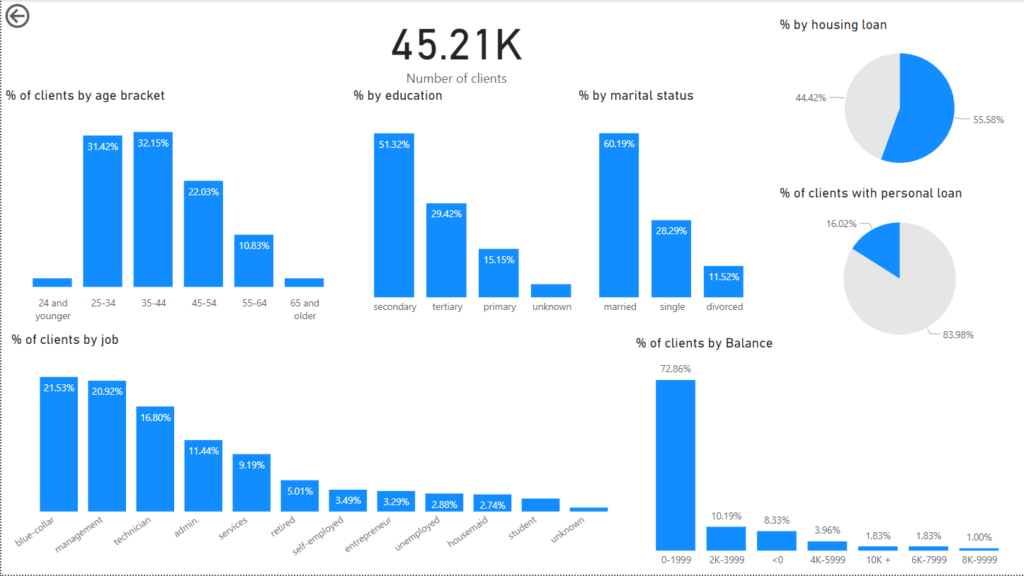
- Demographics
- 45,210 clients participated in the Marketing campaigns
- 63% of the clients are between 25 and 44 years old. 32% are between 45 to 64, 1.79% are 24 or younger, 1.79% are 65 or older
- The three most common jobs are blue-collar jobs, management, and technicians, adding up to 59.2% of the clients. 21.5% of the clients have a blue-collar job. 20.9.2% are in management, 16.8% are technicians. 11.44% are administrators, 9.19% have a service-related job and 5.01% are retired. 15.11% are self-employed, entrepreneur, unemployed, housemaids, students, or have unknown jobs. are self-employed, entrepreneur, unemployed, housemaid, students or unknown.
55.58% of clients have a housing loan. 16.02% have a personal loan
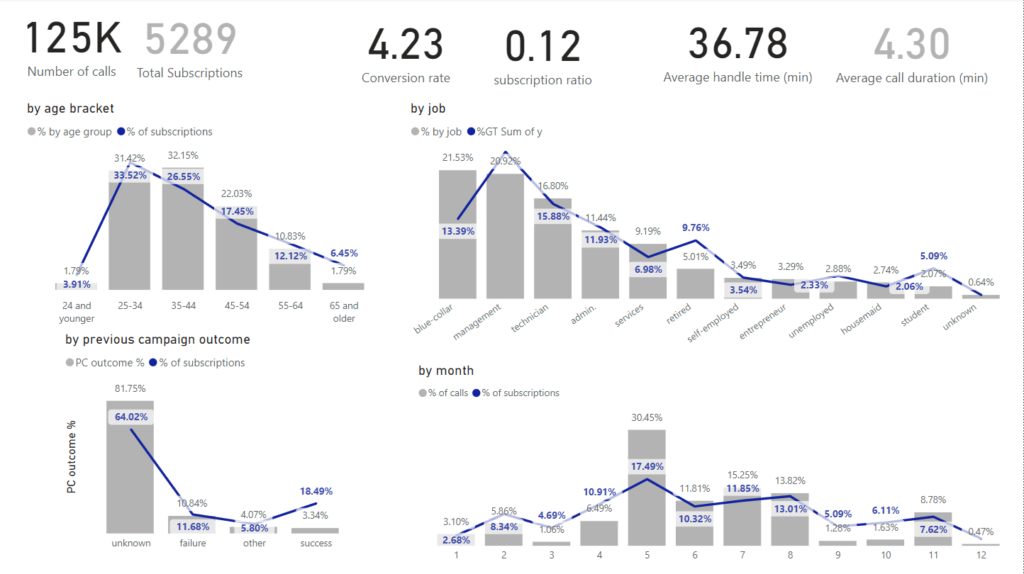
B. KPIs and descriptive analysis of the marketing campaigns
- Conversion rate is above average for telemarketing campaigns at 4.23% with 125000 calls and 5289 subscriptions to the term deposit.
- Average Handle Time is 36.78 minutes. Average call duration is 4.30
- 12% of clients have subscribed to a term deposit.
- Clients with a management job have the highest percentage of subscription at 24.6% While clients with blue-collar jobs have the lowest of the top 3 jobs at 13.39%. Technicians have a 15.88% of total subscriptions.
- Management, retired and student portions of the clients subscribe to the term deposits relatively more than other jobs. 21% of clients have a management job, but 24% of subscriptions come from these clients, retired clients account for 5% of the clients and 9.7% of the subscriptions. Students are 2.07% of the clients and represent 5% of subscriptions.
- The month with the best subscription percentage, May, has 4% more subscriptions than the second best, August, while more than double the calls were performed in May than in August. Most of the calls were performed during May, June, July and August.35.45% of the calls were made in May and 17.49% of the clients subscribed the same month. Followed by July (11.85%% subscription and 15.25% of the calls), August(13.8% of subscriptions and 13.82% of the calls) and June (10.32% of subscriptions and 11.81% of the calls)
- The best predictor of subscription overall was the success of another marketing campaign on the client, however only 3.34% of clients have said yes to another campaign and there is no information for 64% of clients.
- The months with the highest conversion rates are March, September, October and December, but they are also the months when the least calls are performed. This could mean potential for more subscriptions during those months.
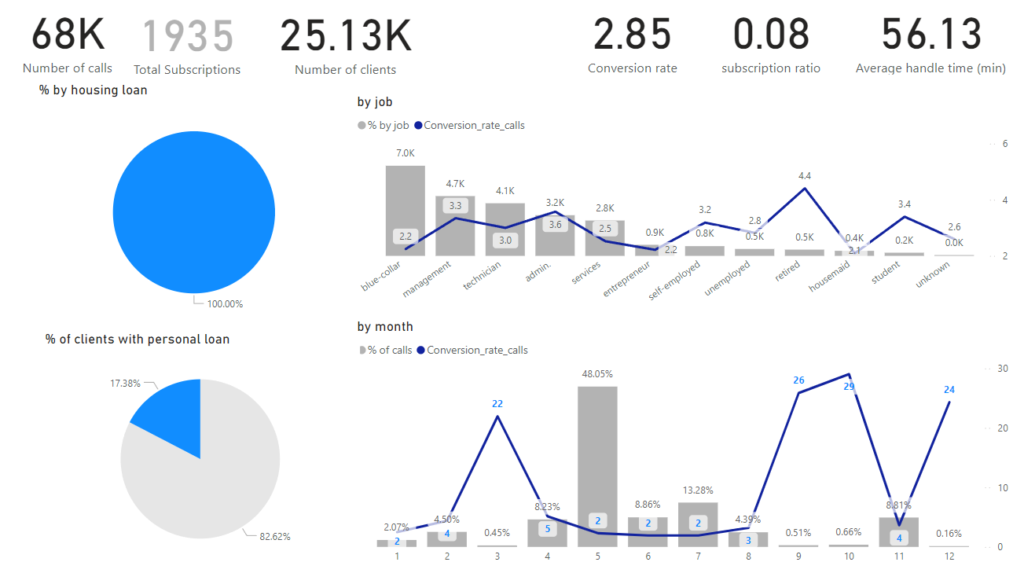
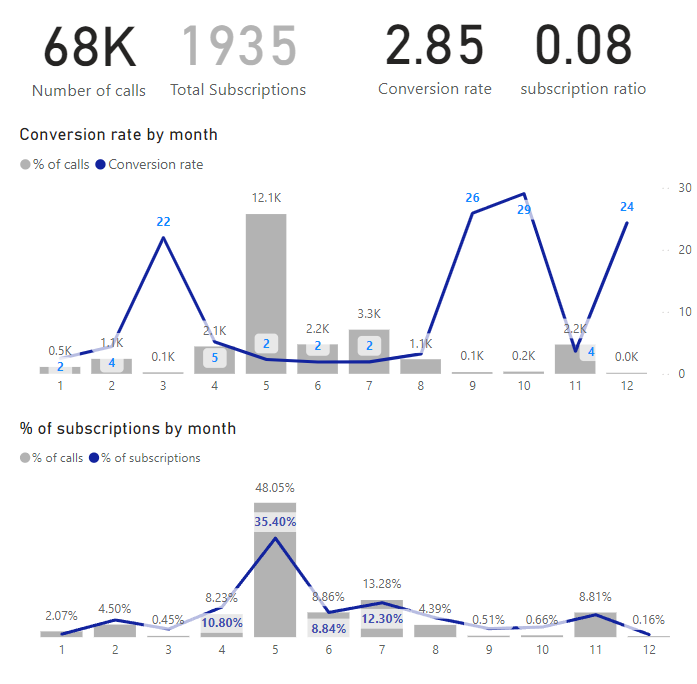
C. Results of calls to clients with loans
- Clients with a housing loan subscribe substantially less than clients without housing loan. The conversion rate for all clients was 4.23, while for the clients with housing loan it was 2.85. Conversion rate for clients without housing loans was 6.45
- The job with most loans are blue-collar jobs, management jobs and admin jobs. Blue-collar at 24%, management at 19.25%, admin at 19.62% and technician at 14.72%.
- Calls to clients with loans follow the same pattern as the calls to clients without. The calls are distributed similarly through the year and are called on average a similar number of times
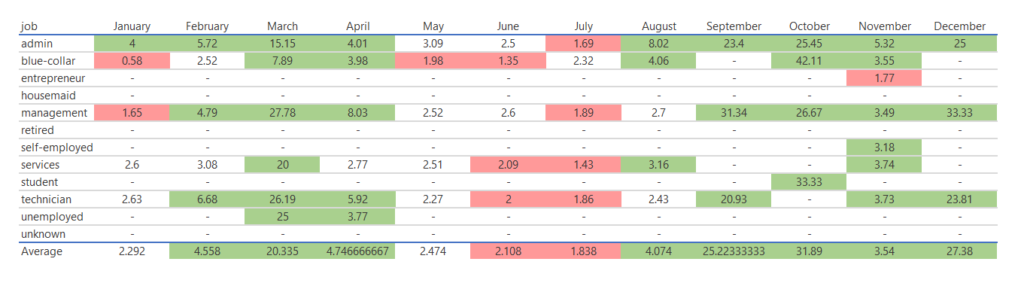
- Blue-collar clients with housing loans are less likely to subscribe than other jobs with loans. Conversion rate for blue-collar clients with this loan is 2.2. For management 3.3, for technicians 3.0 and for admin. 3.6.
- Jobs with the best conversion rates were Technician, Management and admin.
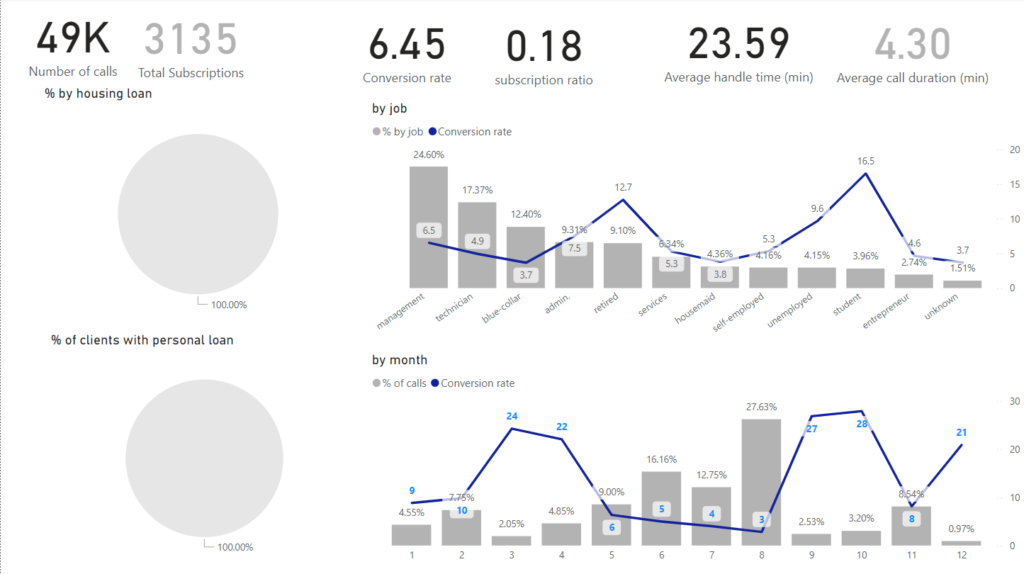
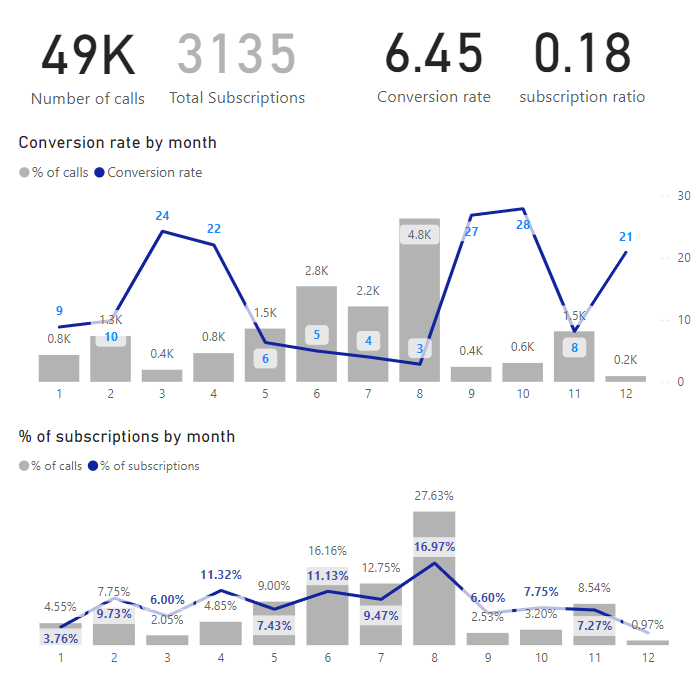
- Results of calls to clients without loans
- Clients without loans have an overall conversion rate of 6.45. Of the top 4 occupations, admin positions have the best conversion rate at 7.5. management are in second place with 6, technicians in third with 4.9 and blue-collar in fourth with 3.7
- Students, retired, unemployed and admin have the best conversion rates at 16.5, 12.7, 9.6 and 7.5 respectively.
- The months with the best conversion rate are March, April, September, November and December.
Recommendations:
Based on the insights and findings above, the following recommendations are provided:
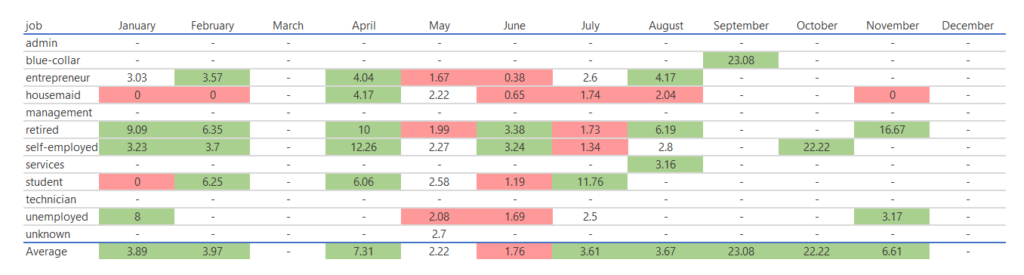
- Modify the distribution of calls to clients according to their occupation, but especially based on if they have a housing loan or not. Fewer calls should be made to clients with occupations lower than the average conversion rate for clients with loans (2.2) and more attempts should be made to occupations with higher than average for telemarketing campaigns conversion rates (3.0). Bellow is a table with suggested modifications. Highlighted in green are months when calls to a specific occupation should be increased and highlighted in red are the calls that need to be cut down. Occupations with less than 30% of the number of calls to the most represented occupation are too small to be compared to the most called occupations, but they are included in a separate table.
- Clients with a housing loan are more likely to subscribe in May, as the current strategy shows. However clients with blue-collar jobs are still unlikely to subscribe. Instead, October has good potential with client in blue-collar jobs. Clients with jobs in services have a low subscription rate in July, however, March could be a good alternative month to contact them. Something similar happens with technicians and Managers.
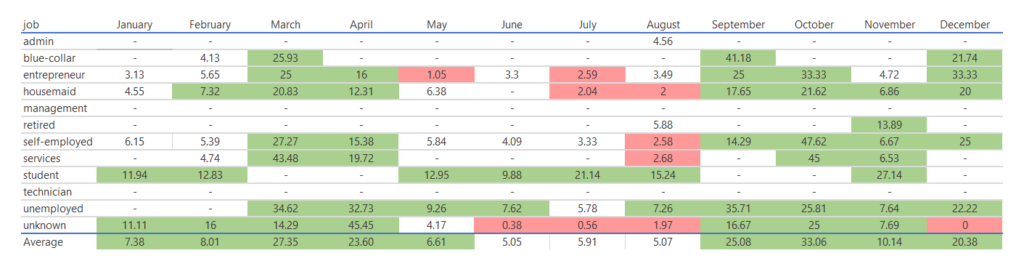
Calls to clients without housing loans can be increased in the cases where the conversion rate is higher than the average for clients without loans (6.45) and decreased when they are less than the average for finance telemarketing campaigns (3.0). While August is the month with the best subscription percentage, the conversion rate is low compared to other months. Fewer calls should be made in the month of August to clients with blue-collar jobs and technicians and more in October. Fewer calls should be made to managers in August and more in September.
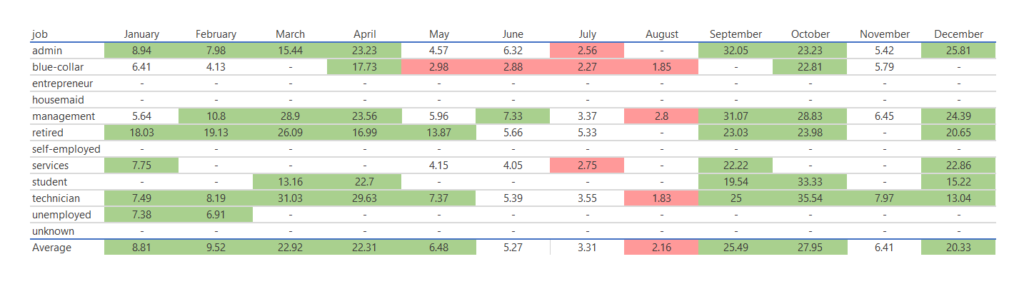
While information is limited due to small samples for some of the jobs, the following table could be of use as a rough guide. Clients who are entrepreneurs, housewives, retired, self-employed and students who have housing loan have good conversion rates in April
For clients without housing loan the best months to contact them based on the conversion ratio and the sample size are February, November, April, September and October
Assumptions and Caveats:
Throughout the analysis, multiple assumptions were made to manage challenges with the data. These assumptions and caveats are noted below:
- Average conversion rate for telemarketing campaigns was taken from the conversion Benchmark report of 2023 by Ruler Analytics (https://www.ruleranalytics.com/blog/insight/conversion-rate-by-industry/)
- The distribution of calls throughout the year is not random, but designed using previous marketing campaigns results.
- The job of the clients is known before making the call
Leave a Reply